Beyond the Field Visit: Automating Crop Performance Analysis for Farmland Lease Decisions
Case Study Summary
Industry: Agricultural Technology / Precision Agriculture
Impact Metrics:
- Systematic, reproducible analysis across up to 10 crop-season combinations per field evaluation
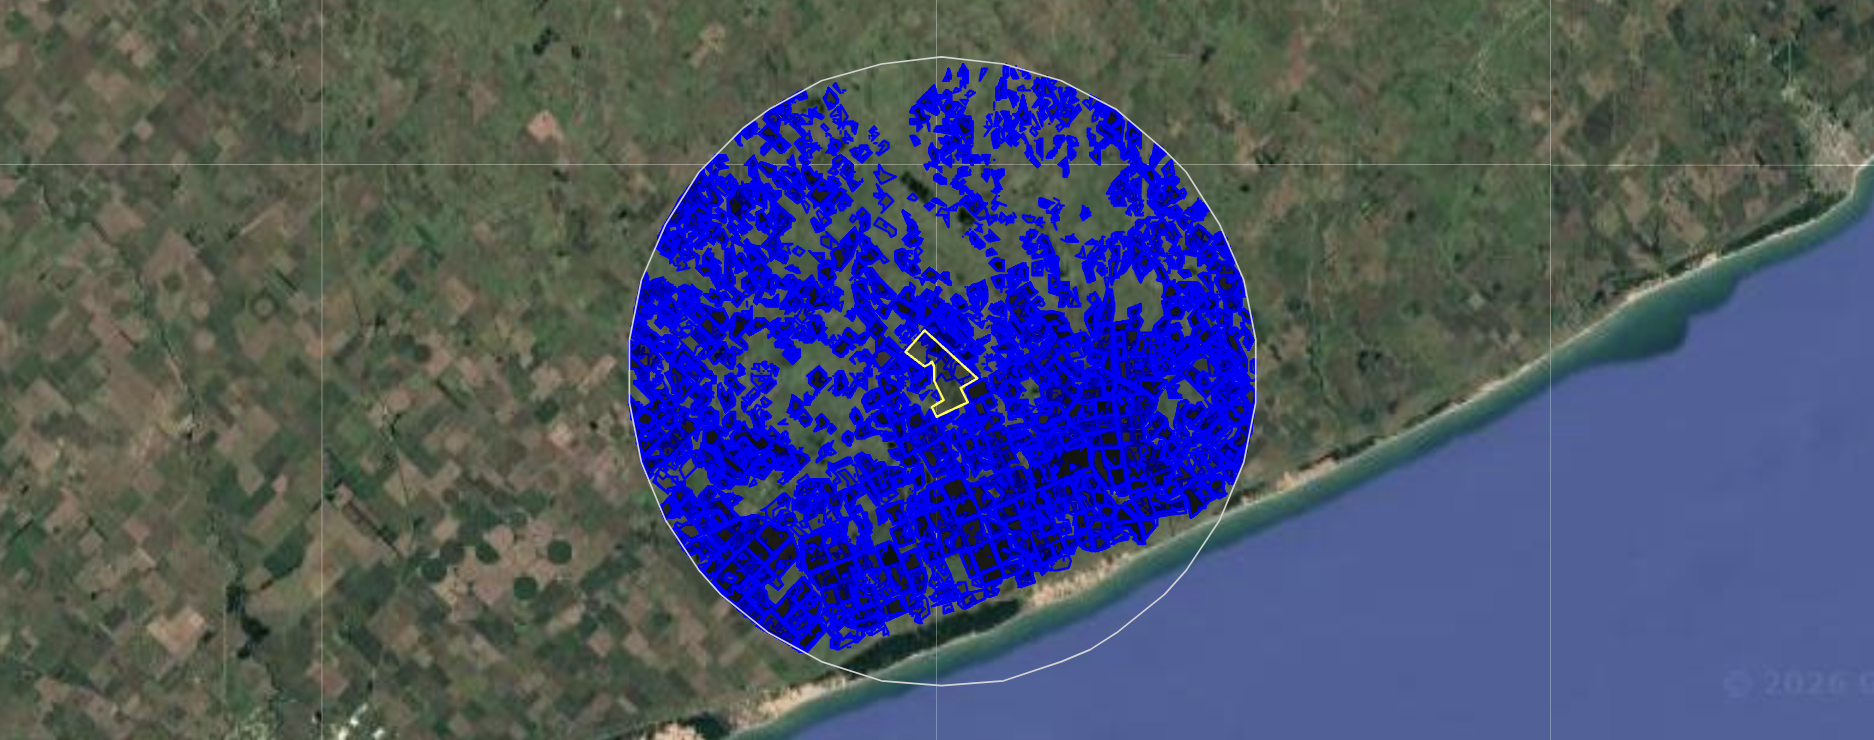
- Comparison area covering a 20 km radius, including all neighboring fields growing the same crop in the same campaign
- Workflow reduced an unstructured, time-intensive comparison process to a consistent, reusable pipeline
- Output delivered as interpretable visualizations ready to support lease negotiation without requiring GIS expertise from end users
Overview
This project delivered an automated remote sensing workflow to support farmland lease evaluation decisions. Using Sentinel-2 satellite imagery and the Google Earth Engine Python API, the system benchmarks the NDVI performance of a candidate field against neighboring lots growing the same crop in the same season, producing interpretable histograms that contextualize the field within its local agronomic environment.
The Challenge
The farmland leasing team at an agricultural company needed a more structured way to evaluate candidate fields before committing to a lease. The core business risk was straightforward: leasing a field at a high price only to find that its productive performance is below average for the local context.
Before this workflow existed, comparing a field against its surroundings relied on ad-hoc analysis that was time-consuming, inconsistent across evaluations, and difficult to replicate. There was no standardized method to answer a simple but commercially significant question: how does this field perform relative to nearby lots growing the same crop?
Ground truth data, such as yield maps or crop records, was often unavailable at the time of evaluation. Any solution had to work without it.
Technical Approach
Technology Stack
- Satellite Imagery: Sentinel-2 (10-meter spatial resolution)
- Processing Platform: Google Earth Engine (Python API)
- Language: Python
- Input Data: Field boundary layers (KMZ or Shapefile)
- Output: Per-campaign, per-crop NDVI histograms
Methodology
The workflow follows a clear analytical structure: classify crop types, extract NDVI values at the lot level, and compare the target field against a representative sample of neighboring lots.
Workflow Architecture
flowchart TD
    A["📂 Field Boundary Input<br/>(KMZ / Shapefile)"] --> B["🛰️ Sentinel-2 Image Collection<br/>(5 most recent seasons)"]
    B --> C["🌾 Unsupervised Crop Classification<br/>Maize · Soybean"]
    C --> D["✂️ Negative Buffer<br/>15 m inward per lot"]
    D --> E["📊 NDVI Extraction<br/>Median per lot · Peak in critical window"]
    E --> F{{"Evaluated Field"}}
    E --> G{{"Neighborhood<br/>(20 km radius)"}}
    F --> H["🔗 Merge lots by crop + campaign<br/>Single representative value"]
    G --> I["📐 Filter by same crop + campaign<br/>Percentile calculation"]
    H --> J["📈 Histogram Output<br/>Field position vs. local distribution"]
    I --> J

    classDef proxy fill:#EED5CF,stroke:#B5C0C0,stroke-width:2px,color:#3A4040
    classDef core fill:#DDEAF6,stroke:#B5C0C0,stroke-width:2px,color:#3A4040
    classDef data fill:#D6CCFF,stroke:#B5C0C0,stroke-width:2px,color:#3A4040
    classDef cache fill:#E7F5C5,stroke:#B5C0C0,stroke-width:2px,color:#3A4040

    class A,B proxy
    class C,D,E core
    class F,G,H,I data
    class J cache
**Key components**:
- **Classification**: Unsupervised crop identification applied independently per season
- **Buffer**: 15-meter negative buffer applied to all lot geometries to reduce edge noise from mixed pixels
- **NDVI metric**: Median NDVI within each lot; peak value within the crop's critical growth window used for comparison
- **Neighborhood**: All lots classified as the same crop within a 20 km radius around the evaluated field
- **Aggregation**: For the evaluated field, all same-crop lots in a given campaign are unified into a single geometry to produce one representative value per crop-season combination
Implementation Highlights
Step 1 — Input ingestion and lot preparation
The workflow accepts a field boundary layer (KMZ or Shapefile) as its only manual input. Once loaded, each lot within the field is processed independently. A 15-meter inward buffer is applied to all geometries before any pixel extraction to reduce contamination from border effects, particularly relevant for smaller lots where edge noise can meaningfully distort the NDVI signal.
Step 2 — Crop classification
A non-supervised classification is applied to identify maize and soybean lots, both for the evaluated field and for the surrounding area. The classification runs independently per campaign across the five most recent cropping seasons available at the time of evaluation.
One meaningful limitation in this step is the distinction between early and late maize cycles. Because these differ in their timing relative to the critical NDVI window, they can introduce noise if treated as a single class. The current workflow does not differentiate between them, and results for maize should be interpreted with this in mind.
Step 3 — NDVI extraction and aggregation
For each lot classified as maize or soybean, the median NDVI within the lot geometry is computed, and the peak value within the crop's critical period is retained as the representative metric. For the evaluated field, all lots of the same crop in a given campaign are merged into a single geometry, and a single peak NDVI value is derived from it.
Step 4 — Neighborhood comparison and output
Neighboring lots classified as the same crop in the same campaign are collected, and their peak NDVI values form the reference distribution. The evaluated field's value is then placed within that distribution and its percentile position is calculated. The output is one histogram per crop-season combination, showing the local NDVI frequency distribution with the evaluated field's position marked as a vertical line.
![]()
Note: The NDVI value shown in the outputs is multiplied by 100 (i.e., expressed as a percentage) to reduce the storage size of the resulting raster.
Results & Impact
The workflow did not transform how farmland decisions are made. It made one specific part of the process faster, more consistent, and less dependent on individual judgment applied without context.
Key outcomes:
- Systematic benchmarking: Any field can now be evaluated against its local agronomic context in a repeatable way, regardless of who runs the analysis or when.
- Broader temporal coverage: Comparing performance across five cropping seasons reduces the effect of any single anomalous year on the assessment.
- Negotiation support: Placing a field's NDVI percentile within its local distribution gives the leasing team a concrete, data-backed reference point for price discussions.
- Operational efficiency: What previously required unstructured, time-consuming spatial analysis is now handled by an automated pipeline that produces ready-to-use outputs.
Honest limitations
The workflow performs well for maize and soybean under typical conditions, but crop classification is not perfect. Results should be read as supporting evidence alongside field visits and agronomic judgment, not as a standalone decision criterion. Early vs. late maize ambiguity remains a source of noise in the classification step that the current implementation does not fully resolve.
My Contributions
- Problem framing: Translating the leasing team's evaluation process into a tractable remote sensing workflow with clearly defined inputs, outputs, and comparison logic.
- Architecture design: Structuring the pipeline around lot-level analysis, unsupervised classification, and a percentile-based comparison framework.
- Technical implementation: Full development in Python using the Google Earth Engine Python API, including image collection filtering, crop classification, buffer logic, NDVI extraction, neighborhood assembly, and histogram generation.
- Output design: Defining the histogram format and the visual encoding of the field's percentile position to make results directly interpretable by non-technical stakeholders in the leasing team.
- Limitation documentation: Identifying and communicating the classification constraints, particularly around early vs. late maize, so that end users could interpret results with appropriate confidence.
-
Is remote sensing part of your decision-making process?
If you work with farmland evaluation, crop monitoring, or agricultural data and want to turn satellite imagery into actionable business intelligence, let's talk. I offer a free 30-minute session to explore whether this kind of workflow fits your operation.